Amazon Catalog Performance Analyzer
A dashboard that turns Amazon Brand Analytics reports into catalog insights. Funnel, trends, ABC analysis, shipping impact, and anomaly detection. Drag-and-drop, zero configuration.
Amazon Brand Analytics reports are a problem disguised as an opportunity. They arrive as CSVs with different formats, delimiters that change, numbers in EU or US format depending on the marketplace. To actually read them you need advanced Excel and time. I built a tool to solve this problem, first of all for myself.
The project
Amazon Catalog Performance Analyzer is a dashboard that turns those raw CSVs into a complete catalog overview with a drag-and-drop. No configuration, immediate insights.
The questions it tries to answer: where does the purchase journey break down, which products generate traffic but don’t convert, how do shipping times affect catalog visibility, which anomalies need immediate attention.
What’s inside
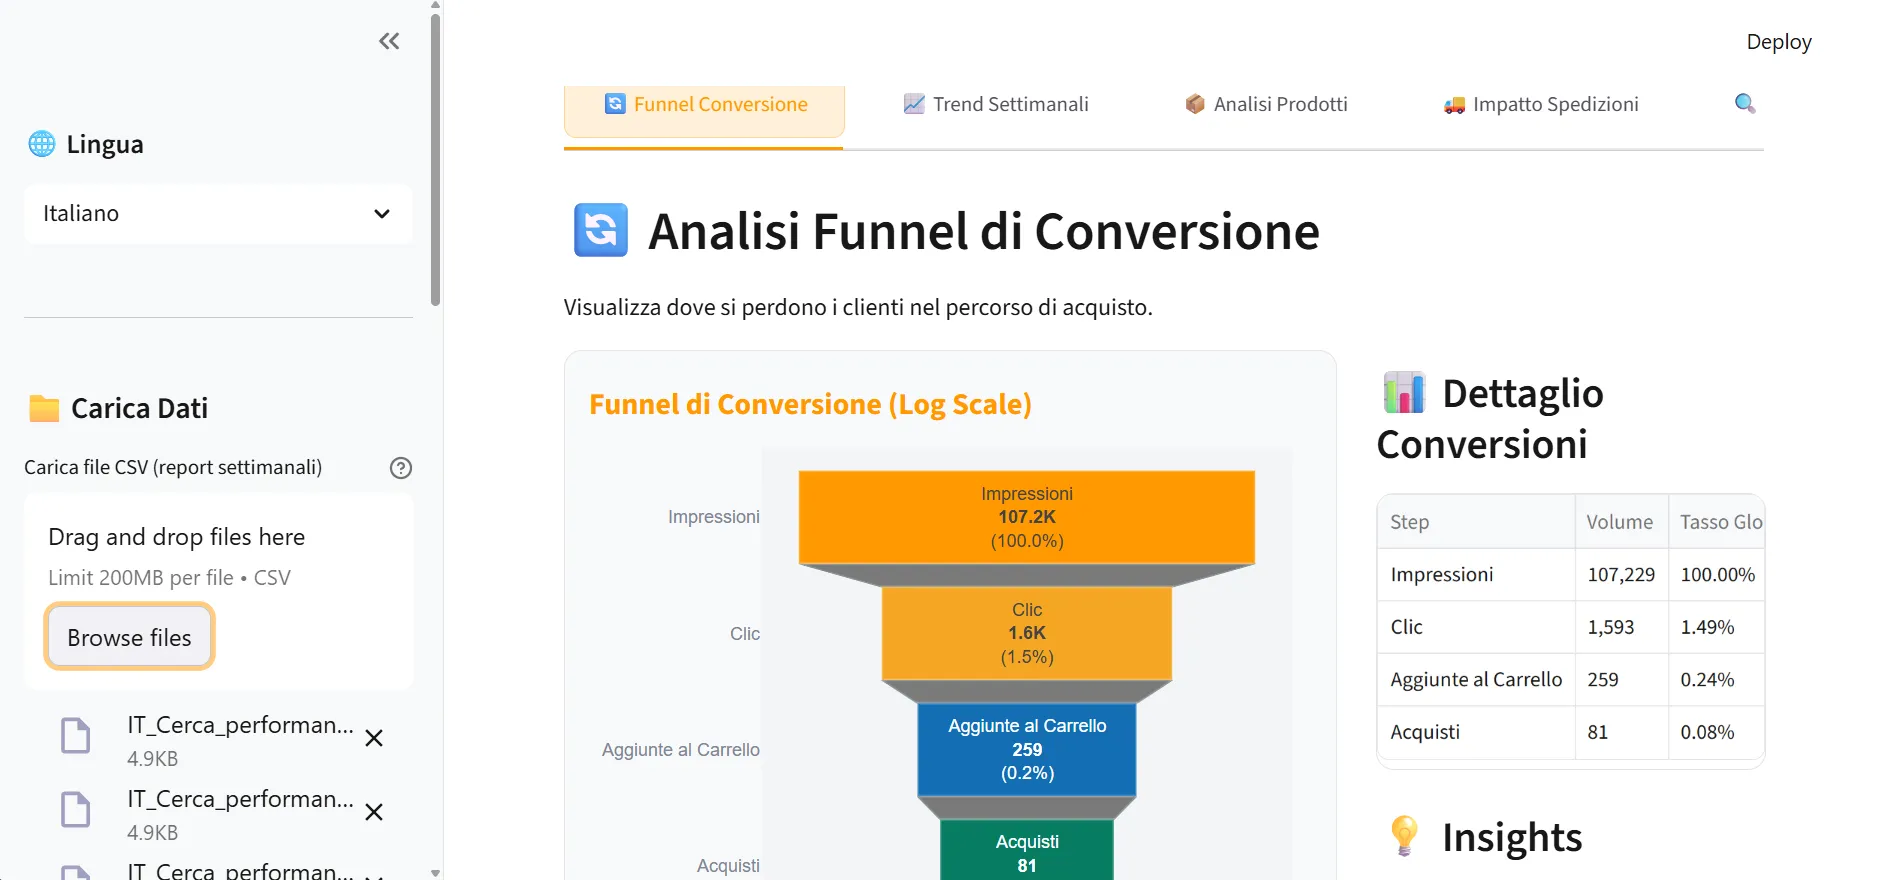
Conversion funnel. Impressions, clicks, add-to-carts, purchases. Drop-off rates are calculated at each step and bottlenecks surface on their own.
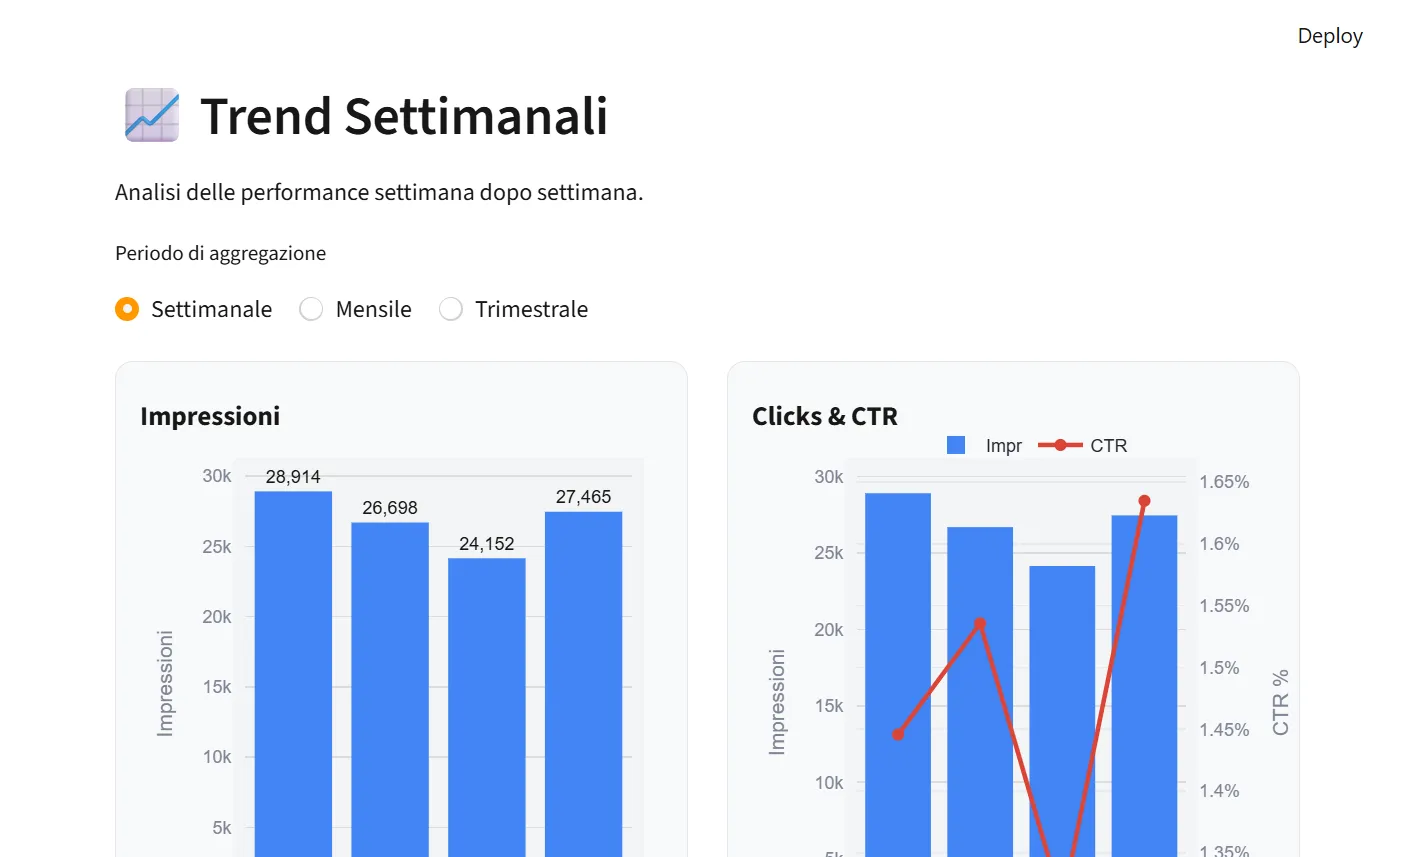
Trend analysis. Aggregation by week, month, or quarter with dual axes to read volumes and percentages together. Period-over-period variations calculated automatically.
ABC analysis. Catalog segmentation following the 80/20 rule. A products (top 80% of revenue), B, and C, with price/conversion scatter plots to immediately spot what’s out of place.
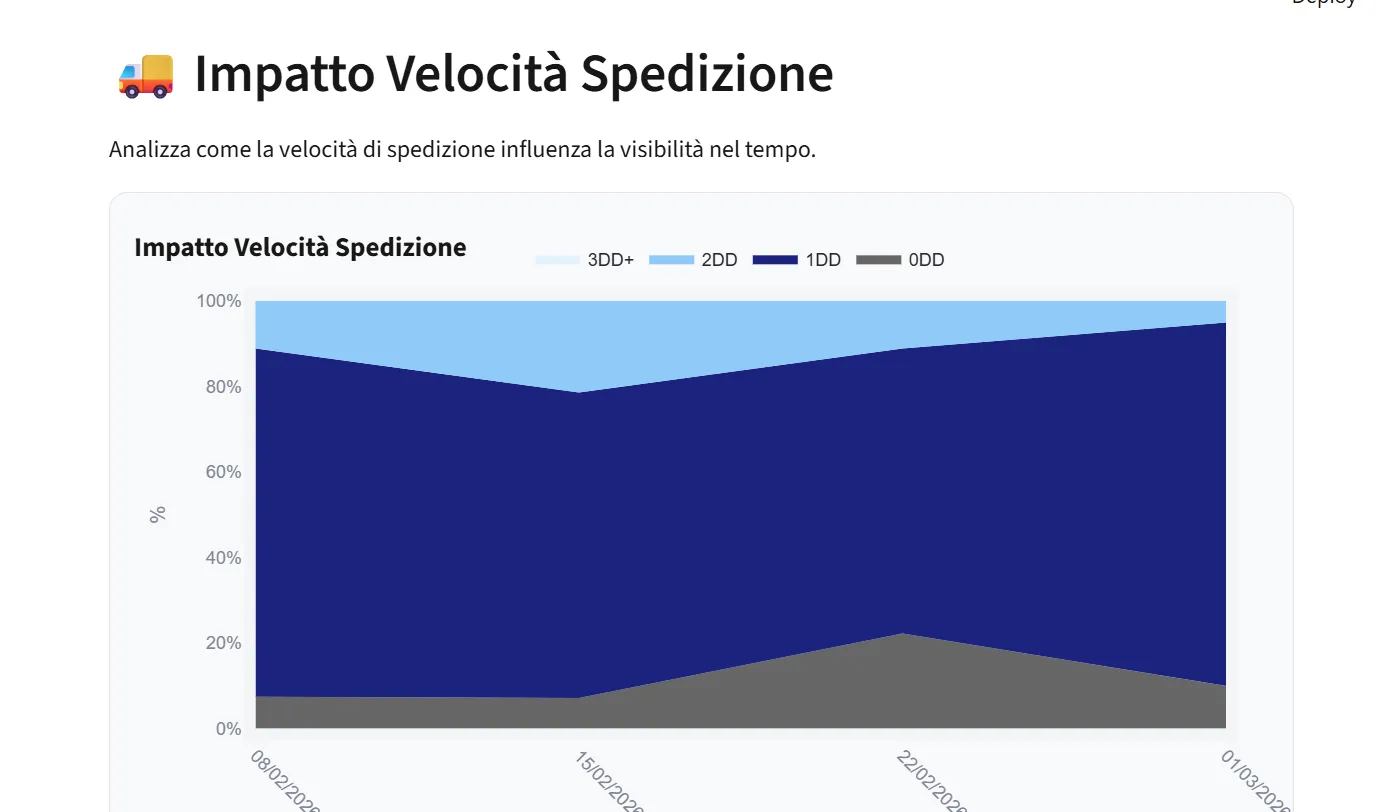
Shipping impact. A dedicated dashboard to understand how same-day, 1-day, 2-day, and 3+ day delivery affect catalog visibility over time.
Anomaly detection. Automatic alerts with configurable thresholds: CTR drops over 30%, CVR drops over 30%, sales crashes over 40%, high-visibility products with conversion below 0.5%.
Export. CSV of filtered data and an HTML report ready to print as PDF, with KPI cards and top 10 products.
The technically interesting parts
Multi-format parsing. The app detects the delimiter on its own, handles EU and US decimal formats, and has an encoding fallback from UTF-8 to Latin-1. Works with any Amazon export without touching a thing.
Logarithmic scales. When data spans different orders of magnitude (millions of impressions, hundreds of purchases), normalization keeps charts readable without distorting proportions.
i18n without reload. Dynamic Italian/English switch with session state persistence and HTML escaping on all user-generated content to prevent injection.
Screenshots